Measuring Principles
(changed July 2024)
I Introduction
1. Preface 2. Primary circuit 3. Experimental setup
II Theoretical Backgrounds
4. Biological signal sources 5. Voltage sources in the circuit 6. Resistances in the circuit 7. Ohm´s law relations . 8. Sensitivity to emf- and R-components 9. Interactions by emf- and R-components 10. Electrical current
III Review of EPG measuring systems
11. EPG systems 12. Conclusions
Appendix: Controverses and claimed disadvantages of DC system property failures
______________________________________________________________________________________________________________________________
I Introduction
1. Preface
EPG systems used now and in the past can divided into DC, AC, and combined AC-DC systems. One may go directly to Section III for a review but to understand that section better it is wise reading first Sections I and II.
In the EPG technique, an insect with piercing mouthparts and a plant are made part of an electrical circuit by connecting each to an electrode, one to the insect and one to the plant. Also, other 'arthopodes' with piercing mouthe part (such as a mites or thicks) and other ‘feeding substrates’ (such as a prey animal or an artificial substrate behind a membranecan) be used. The electrodes are connected to the electronic measuring circuit, called 'primary circuit' .
In addition to the measuring principles this article aims to discuss a number of confusing papers (e.g. Backus et al. 2019; Backus & Patterson 2023) containing incorrect interpretations of the Ohm's law relations in the primary circuit. The authors claim that the present and past DC-EPG system design would have unsuitable properties. Though some properties of the primary circuit may still need further experiments, most properties and their signal consequencies are fairly well known at present.
2. Primary circuit
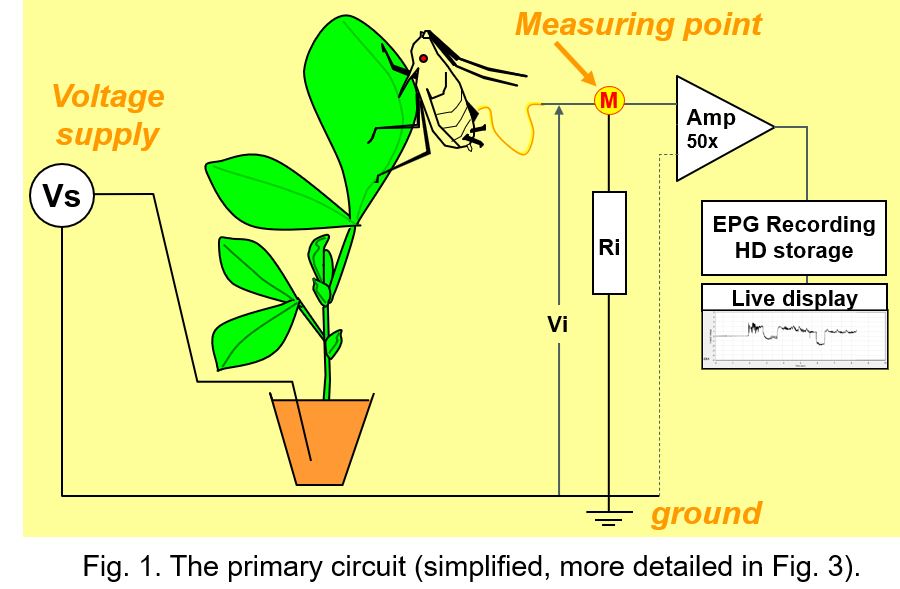 All EPG systems have a similar primary circuit (Fig. 1), but some properties are different and determine what aspects are recorded in a greater or lesser extent. The user controlled voltage supply (Vs) source provides an AC, DC, or mixed AC and DC voltage to the circuit. One lead of the Vs source is connected to ground and the other lead to the plant, mostly the soil in which the plant is growing. The insect on the plant is attached to a thin flexible gold wire electrode that leads to the signal measuring point (M) of the circuit, which is the input of the head stage amplifier (Amp; for DC systems 50x gain).
The fluctuating voltage between the measuring point and ground - Vi across the input resistor Ri (typically 109Ohm) - represents the EPG signal recorded and visualized on the computer. In fact, the amplifier internal resistance (parallel to Ri; Fig.1 dotted line) is much higher (about 1012Ohm) than Ri, and negligible, therefore. The properties of the amplifier is not part of the primary circuit and have no effect on the EPG signal (this also applies to any subsequent circuit for signal processing). Though signal processing in DC systems is restricted to simple amplification, it is more complex in AC systems (see chapter 11). The voltage fluctuations in the signals shows certain patterns that have been distinguished and described as EPG waveforms characterized by amplitude, frequency, and voltage level. For a number of insects the waveforms have been correlated experimentally with the insect's stylet penetration (probing) activities and the stylet tip positions in the plant tissues and cells.
 3. The experimental setup
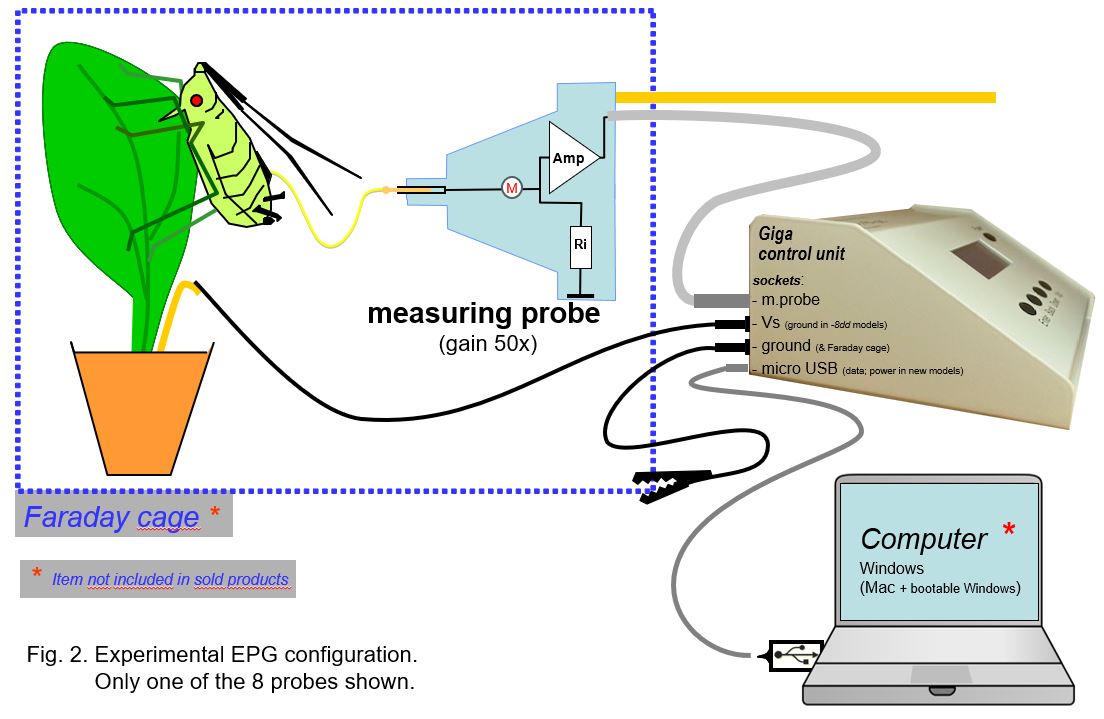
The EPG device (see page Products) has a main control box and a (mostly 8) separate EPG (measuring) probe units (Fig. 2). The head stage amplifier or EPG probe input at (M) is the most noise sensitive part of the primary circuit. This measuring EPG probe should be mounted inside a Faraday cage to protect the head stage amplifier against noise from 220VAC 50Hz (or 110VAC 60Hz) power cables in the lab. The cage and the device are grounded to each other (alligator clip) or to the water supply or central heating system. Recent DC devices are powerer by a USB cable, used for data transfer to the computer as well.
Plants, insects, and measuring probes should be shielded by placing them inside the Faraday. The measuring probes (coax-)cables (75cm) are are shielded and and allow the control box to be put outside the Faraday cage. This provides noise free operation of its pushbuttons for individual channel (insect) settings: the adjustable voltage supply (Vs) 0±120mV, the -50mV calibration pulse, the gain (50-100x), and the Ri switch button between 1GOhm and 10TOhm (internal amplifier input resistor), All settings are displayed on the small device display. The output signals to the computer (USB) are digitized (internal AD converter), HD stored, and real time displayed on the PC monitor using data acquisition software..
II Signal sources
4. Biological signal sources
The direct biological sources of the signal voltages are: 1) sources generated by the plant-insect combination; called electromotive force (emf) components, and 2) due to changes of the electrical plant-insect resistance; called R-components. In fact the R-components are not a voltage source as such, but they modulate the amplitude of the internal plant-insect emf-components as well as external plant-insect voltages in the primary circuit.
The emf-components mainly originate from fluid movements in the two capillary stylet canals, these are called streaming potentials. Also, the membrane potentials of plant cells when punctured by the stylets play a role but these provide the less fluctuating voltage levels of the signal: extracellular versus intracellular stylet tip positions. Other internal insect and plant voltage sources such as muscle and nerve potentials in the insect and fluctuating plant cell potentials (e.g. sieve element depolarizations) do not contribute to the signal since they are short-circuited by their surrounding hemolymph and plant tissue conductance respectively.
The R-components, mainly caused by movements of the valves associated with the food and salivary stylet canals. The effect of valve opening is a reduction of the insect resistance - thus increasing the measured fraction of the internal emf-component voltages - and valve closing causing the opposite effect. Some (presumably small) resistance fluctuations may be caused by resistance changes due to a fluctuating composition of saliva and plant sap. The other important voltages sources that are modulated are the external (not biologically related) voltages from the user operated voltage source Vs and the (most of the time rather stable) electrode potentials caused by the insect and plant electrode interfaces acting as a galvanic element due to their metal-electrolyte differences. More source details and interactions between voltage sources and resistances are discussed in more detail in the next two chapters.
5. Voltage sources in the circuit
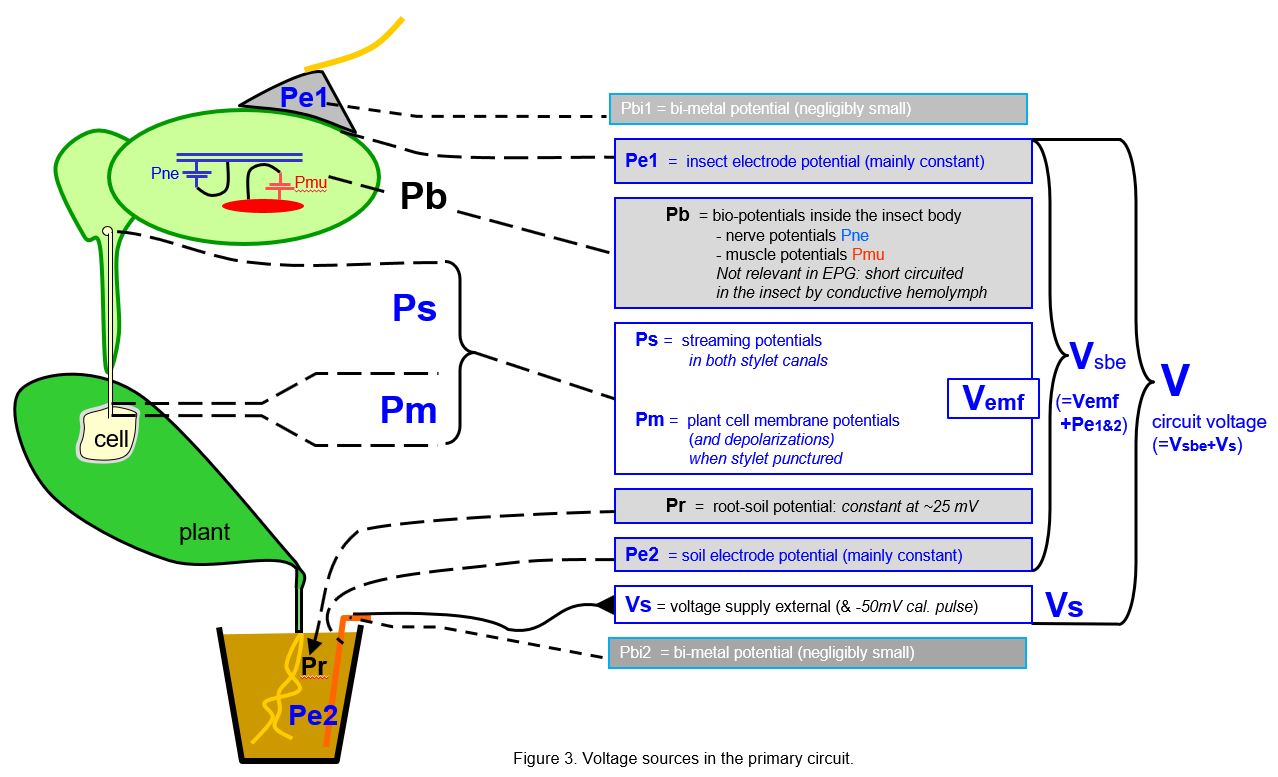
The voltage sources playing a role in EPG signals are depicted in Figure 3. The relevant (blue) voltage sources are:
- the electrode potentials Pe1 and Pe2 due to the insect and soil electrode interfaces*, the silver glue/epidemal fluids and copper/soil fluids, respectively. Together these are acting as a galvanic element that is sometimes substantial (between ±200mV*) but they are rather unpredictable and may differ between chanels (insect-plant replicates) and though rather stable later they mostly seem to decrease initially.
- the streaming potentials (Ps) in capillary stylet canals due to fluctuating fluid movements in the capillary stylet canals
- the membrane potentials of punctured plant cells (Pm; -50 to -120mV) of plant cells when punctured by the insect’s stylets. Pm is rather constant but may differ between cell clusters.
Pm and Ps together are representing the emf-components (Vemf) in the EPG signal.
A few other voltage sources shown in Fig.3 are not or less relevant, such as: the negligibly small bi-metal potential(s) by metal-metal wire connections at the insect and the soil electrode side; the bio-potentials (Pb) from insect nerves and muscles that are short circuited internally by the surrounding hemolymph; and the small and rather constant root(-soil) potential (Pr). All preceding voltage sources are summed and indicated here as the voltage sources between the electrodes (Vsbe), the ‘voltage between the electrodes’.
Finally, there is the external supplied voltage source Vs (range ±500mV), which is user controlled.
The voltage supply Vs has two functions:
- it is used to compensate for the unpredictable electrode potentials (Pe1 and Pe2) adjusting the signal amplitude and voltage level
- it can be used to distinguish R-components (see next chapter) in waveforms when used during recording, thus enabling some signal feature details to assist in identifying some waveforms.
In the Ohm’s law considerations of next text chapters it is easy distinguish the sum of Vemf and the electrode potentials Pe1&2 as the 'voltage sources between the electrodes' Vsbe, as well as the sum of Vsbe and Vs as V, called 'circuit voltage'. Thus, V is the sum of all major voltage sources in the primary circuit which play a role in the Ohm's law considerations in the following chapters.
* Note: Electrode potentials should be taken seriously as a voltage source (Neher, 1974; Wkipedia). In Backus et al. (2009, 2018, 2020, and 2023) the electrode potentials are neglected or denied, which resulted in a neglect of their compensation by the user controlled DC voltage supply (Vs) and poor signals.
6. Resistances in the circuit
Similar to voltage sources, the resistances in the primary circuit (Fig. 4) mainly contribute to the signal when they fluctuate. Their fluctutions modulate the also fluctuating Vemf amplitude and moreover, they modulate the more stable voltages of the circuit voltage V. Stable resistances as such will cause a stable level of the signal voltage related to the proportions of resistances in the primary circuit in accordance to Ohm's law (next chapter). The relevant (red) resistances in the primary circuit are:
- the two electrode resistances, the silver glue-insect cuticle contact (Re1) and the copper-soil/plant contact (Re2) arew relatively low and mostly stable. These hardly play a role in the signal, although the insect electrode resistance may sometimes be high or changes to a higher level due to a poor silver glue attachment, affecting the signal properties.
- the internal insect body resistance (Rin) is small and stable.
- the main stable insect resistance is formed by the insect's stylet canals (Rsc) and their associated valves
- the main fluctuating insect resistance is caused by the valves associated with the food canal (Rfv) which causes a main R-component in EPG signals. This is the morphologcal and functionional well known cibarial valve. However, a valve associated with the salivary duct/canal (Rsv) seems to cause another main R-component but morphologcal and functionional its existance is not clear, in spite of the supposed valve activity indications from EPG signals (phloem waveforms E1 and E2 in aphids).
- the stylet tip resistance (Rst) may strongly increase (Rst) for a short period (<1s) when membrane of the plant cell is sealing the stylet tip opening just before the stylets break through the membrane. The increase may reach values of up to 5GΩ and seems similar to the "giga seal" known from voltage clamp experiments in plant physiology.
- Finally, there remain three resistances to be mentioned: the plant root-soil resistance (Rrs), the soil electrode resistance (Re2), and the internal resistance of the voltage supply (Rvs) source. These resistances are small and stable and don't seem to play any role in the signal.
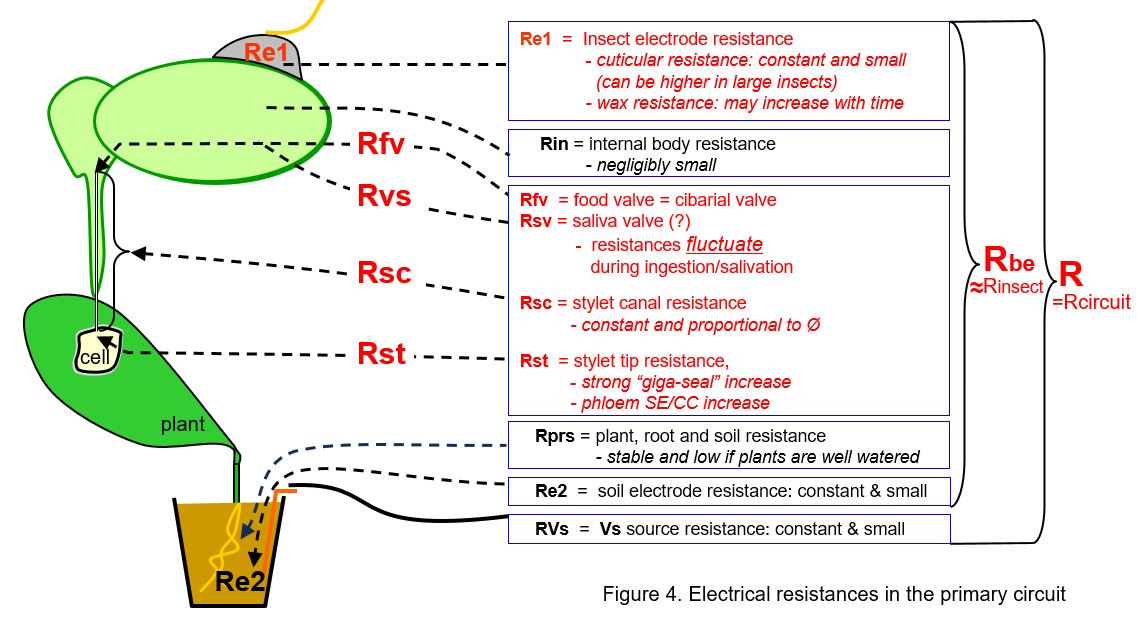
The sum of all resistances above (except Rvs) can indicated as the "resistance between the electrodes (Rbe)", nearly identical to the total circuit resistance (R). The Rbe fluctuation and the amplifier input resistance Ri the primary circuit are determining the ratio between R- and emf-components in the primary circuit; see discussion in next chapters.
7. Ohm´s law relations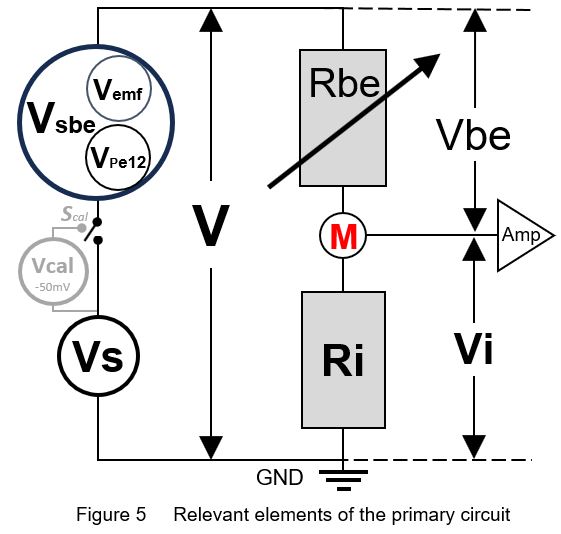
|
To understand how the measured/recorded EPG signal voltage Vi (Fig. 1) depends on the voltage sources and resistances in the primary circuit (Fig. 3 and 4) in accordance of Ohm's law, a simplified diagram of the electrical relevant elements is shown in Fig. 5. _____________________________________________________________________________ Ohm's law: V = I R or I = V / R [ 1 ]
current I in each serial part: I = Vbe / Rbe = Vi / Ri [ 2 ]
emf -component sensitivity*: Vi/V = Ri / (Ri + Rbe) = Viemf/Vemf = Vical/Vcal [ 3 ]
circuit voltage: V = Vsbe + Vs = Vbe + Vi [ 4 ] _____________________________________________________________________________ |
8. Sensitivity to emf- and R-components
The emf-component sensitivity is the response voltage Viemf as the fraction (%) of the original Vemf amplitude, i.e. Viemf/Vemf, which is equal to the Vi/V (equation [ 3 ]). Regardless the fluctuating voltage V, the fraction Vi/V will remain the same at a certain (constant) Rbe value. The Vi/V values (Y-axis) of two assumed Rbe values (107Ω and 109Ω) are calculated and plotted against Ri values in a range of 105-1011Ω (X-axis). The emf-component sensitivity Vi/V are represented by two sigmoid curves, (Fig. 6, yellow 107Ω and blue 109Ω). These emf sensitivity curves have been referred to earlier (Tjallingii 1988, Backus 2019, 2020). Note that the assumed constant Rbe values are used here to explain the emf- and R-sensitivities, in reality Rbe fluctuates, see next chapter. For example, at Ri=107.6Ω (arbitrary value to show) the emf-sensitivity for the insect resistance Rbe of 107Ω is shown by the black double Vi/V arrow (dashed) between the 0% and the yellow 107Ω Rbe s-curve. The signal voltage Vi in Vi/V is measured voltage across the 107.6Ω Ri. The complimentary Vbe/V value - between the yellow s-curve and the 100% represents the voltage across Rbe is not measured across Ri and is not part of the EPG signal. Nevertheless it was incorrectly claimed by Backus (2019; see further next chapter) that Vbe/V would represent the R-component of the signal.
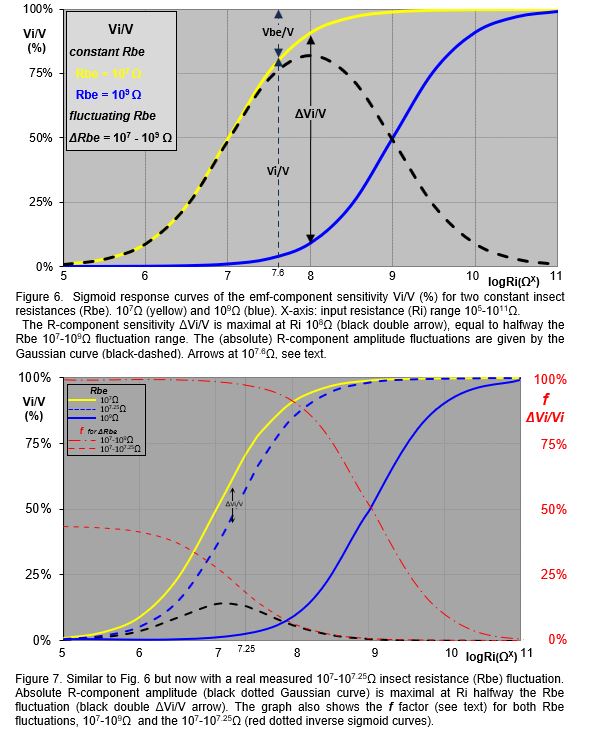 R-component sensitivity is not as straight forward as the emf-component sensitivity. The R-component amplitude is caused by Rbe fluctuation. An insect resistance (Rbe) fluctuation of 107-109Ω will cause a R-component signal (amplitude) between the yellow 107Ω and the blue 109Ω s-curve (Fig. 6). When Ri is 108Ω the R-component is represented by the ΔVi/V black double arrow. The ΔVi/V absolute value of the R-component sensitivity for all Ri values in the 105-1011Ω range is represented by the black dashed Gaussian curve. The Gaussian curve therefore, should be considered as the R-component sensitivity. For the insect resistance fluctuation range (ΔRbe) of 107-109Ω R-component sensitivity ΔVi/V first increases from about 0% to a maximum of about 80% at Ri 108Ω and then decrease to about 0%. The maximum R-component sensitivity (Rbe modulation of V) is at Ri 108Ω, i.e. halfway the (log) Rbe 107-109Ω fluctuation, i.e. when Ri=108Ω; about 80% on the Vi/V scale.
The role of Vbe. Vbe is the voltage across Rbe (Fig. 5, and proportional to thr Fig.6 dashed black Vbe/V double arrow on Vi/V scale (arbitrarily chosen here at 107.6Ω Ri). Although Vbe is complementary to Vi/V is not recorded as only Vi across Ri is the measured signal. Therefore, the assumption that Vbe would represents the R‑component sensitivity (Backus, 2019, 2020) is completely incorrect and should be rejected.
Real Rbe fluctuation. The large 107-109Ω ΔRbe fluctuation range used in the example here is very unlikely to occur in real insect recordings. Though hardly any data of real Rbe values and fluctuations have been measured and published, a 107-107.25Ω (about 8MΩ) ΔRbe fluctuation during a spittle bug waveform has recently been established experimentally (Cornara, unpublished). The spittle bug R-component amplitude maximum at 107.125Ω Ri (value halfway ΔRbe) is only about 12% on the Vi/V scale (Fig.7, maximum of dashed black Gaussian curve and black ΔVi/V double arrow between the yellow and dashed blue s-curve). For aphid E2 pulses (see Fig. 8) a ΔRbe of 109.02-109.04Ω (about 50M) fluctuation range has been measured (Tjallingii, unpublished); maximal 2% Vi/V scale.
R-component in AC and DC systems. The R‑component sensitivity ΔVi/V is the same for DC and AC based EPG devices (primary circuits). The only difference is that the circuit DC voltage level V in DC systems is a mixture of the fluctuating Vsbe (due to Vemf) and the supplied voltage Vs, whereas the AC voltage level V in AC systems is the amplitude of the user controlled oscillator carrier wave that is not depending on DC voltages in the primary circuit. The DC voltages such as Pe1&2 and Vs are filtered out in AC systems. In DC systems the recorded R-components can be modified (increased or decreased) by Vs adjustments without affecting the emf-components. A higher Vs adjustment will result in a higher voltage V level (Fig. 3) and its ΔRbe modulation amplitude. The question at what Ri a 50:50 emf-:R-component recording will occur is irrelevant therefore: the recorded R-component voltage can be modified manually during recording by Vs adjustment, which can be very helpful in waveform separation and identification (chapter 9).
Relative responsiveness f. The Vbe role wrongly interpreted as the R-component sensitivity might have been caused by misinterpreting the earlier discussed ‘relative responsiveness f' to R-components (Tjallingii, 1988). This responsiveness f expresses the R-component fraction ΔVi/V of the emf-component sensitivity Vi/V belonging to the low as part of the high Rbe value (107Ω on the yellow and 109Ω on the blue s-curve, Fig. 6). The f factor is calculated by:![]() . Plotting f versus Ri results in an inverse s-curve (Fig. 7, two red curves) but note: the Y-axis of f is . For a ΔRbe fluctuation between 107-109Ω f increases with decreasing Ri to nearly 100% Vi/V at 105Ω Ri and with increasing Ri at1011Ω f is reduced to about 0%. Though the R-component sensitivity (Fig. 7, black dashed Gaussian curve) has an optimum of about 9% at 107.125Ω, f is highest for the lowest Ri. The ΔVi/V R-component decreases too as the R-component sensitivity shows (black ΔVi/V double arrow). The f factor - similar to the R-component sensitivity - also depends on the ΔRbe fluctuation, and for the more realistic 107-107.25Ω Rbe fluctuation f will increase to only about 37% ΔVi/V scale at 105Ω Ri (Fig.7, right Y-axis), which is only 0.55-0.99% Vi/V scale (left Y-axis). This very small signal therefore, needs a very high gain to be visusalized. A gain of up to 12000x had to be applied when using such low Ri values in the Backus 2019). As in Fig.7, the original graph (Tjallingii, 1988) f was also in the same graph and using a separate Y-axis, ΔVi/V and Vi/V respectively. Though possibly confusing, this difference was clearly explained in the 1988 text. The Vi signal decreases when Ri becomes smaller and depending on the fluctuation range may need a higher gain. The common Ri in DC EPG devices is 109Ω and the usual gain of 50-100x is adequate.
. Plotting f versus Ri results in an inverse s-curve (Fig. 7, two red curves) but note: the Y-axis of f is . For a ΔRbe fluctuation between 107-109Ω f increases with decreasing Ri to nearly 100% Vi/V at 105Ω Ri and with increasing Ri at1011Ω f is reduced to about 0%. Though the R-component sensitivity (Fig. 7, black dashed Gaussian curve) has an optimum of about 9% at 107.125Ω, f is highest for the lowest Ri. The ΔVi/V R-component decreases too as the R-component sensitivity shows (black ΔVi/V double arrow). The f factor - similar to the R-component sensitivity - also depends on the ΔRbe fluctuation, and for the more realistic 107-107.25Ω Rbe fluctuation f will increase to only about 37% ΔVi/V scale at 105Ω Ri (Fig.7, right Y-axis), which is only 0.55-0.99% Vi/V scale (left Y-axis). This very small signal therefore, needs a very high gain to be visusalized. A gain of up to 12000x had to be applied when using such low Ri values in the Backus 2019). As in Fig.7, the original graph (Tjallingii, 1988) f was also in the same graph and using a separate Y-axis, ΔVi/V and Vi/V respectively. Though possibly confusing, this difference was clearly explained in the 1988 text. The Vi signal decreases when Ri becomes smaller and depending on the fluctuation range may need a higher gain. The common Ri in DC EPG devices is 109Ω and the usual gain of 50-100x is adequate.
The R‑component sensitivity ΔVi/V is the same for DC and AC based EPG devices (primary circuits). The only difference is that the circuit voltge level V in DC systems is a mixture of the fluctuating Vsbe (due to Vemf) and the supplied voltage Vs, whereas V in AC systems does not depend on other voltages in the primary circuit than the user adjusted constant AC voltage (amplitude). Stable voltages such as Pe1&2 was filtered out in AC systems in the past (chapter 11.1). In DC systems the R-component can be modified (increased or decreased) by Vs adjustments without affecting the emf-components. A higher Vs adjustment will result in a higher voltage V level (Fig. 3) and its ΔRbe modulation amplitude. The question at what Ri a 50:50 emf-:R-component recording will occur is irrelevant therefore: the R-component can be modified manually during recording by Vs adjustment, which can be very helpful in waveform identification (next chapter).
9. Interactions between emf- and R-components
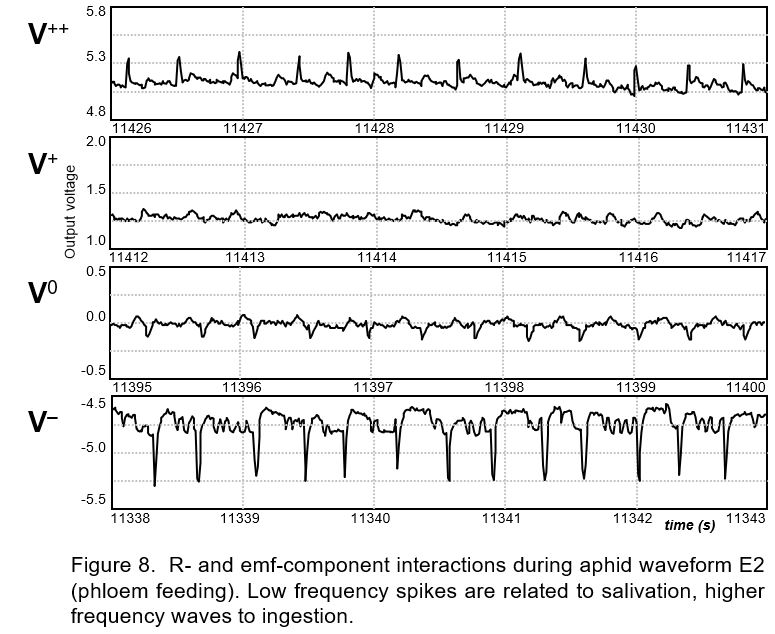
Entangling and interference. Most R- and emf-components in EPG signals are not separately contributing to the signal. Their fluctuations are often similar and coinciding since they have an underlying biological activity in common. For example, when the cibarial valve in the food canal opens the electrical insect resistance (Rbe) will decrease and cause a higher R‑component voltage. Meanwhile the phloem sap flux in the stylet canal increases and causes a higher streaming potential Vemf (emf-component) voltage as well. Thus both components coincide and contribute entangled to the signal. When the emf- and R-component have the same sign they will reinforce each other but if they have an opposite sign they will counteract.
For example, the characteristic E2 spikes are clear when the V level is made negative by Vs adjustment (Fig. 8, bottom V‾ trace). When the V level is adjusted by Vs to a 0Volt level (V0 trace) only the small negative emf-components of these E2 spikes are shown (V0 trace). Further positive V level increase shows no spikes (V+ trace). Then the negative emf-component of the E2 spikes are compensated by the positive going R-component of these spikes. And when the V level is increased further, the E2 spikes appear again, now positive (trace V++). The sign switch and the amplitude changes point to a clear R-component of the E2 spikes.
Measured calibration pulse responses applied during a negative (V‾) and positive voltage Vs adjustment (V++) allowed calculation of Rbe. A 1.9GΩ Rbe was derived from the -50mV calibration pulse responses during the E2 level and 1.8GΩ Rbe was calculated from E2 spike responses before and during the calibration pulses. Thus during the E2 spike Rbe appeared to decrease 100MΩ as compared to Rbe during the E2 level between the spikes. These measurements were shown by E2 spikes in Myzus persicae on Raphanus sativus (Tjallingii unpublished).
Simulated interactions. In order to demonstrate the interactions between emf- and R-components in EPG signals a spread-sheet model was used. The important role played by the level of V is shown too.
First, the signal (Vi responses) were calculated for a sinewave fluctuating Vemf source (Vemf=0±5 mV) at 5 voltage V levels (-20, -10, 0, 10, and 20 mV as normally set by adjusting Vs). In Fig. 9A this is shown for a constant Rbe. The amplitudes of the Vi responses are equal for all 5 V levels, only the voltage levels of Vi differ accordingly.
Next the Vi responses are calculated when Rbe (insect resistance) fluctuates- in phase with the Vemf sinewave - with an amplitude of 108.8±0.05Ω (about 630±70MΩ) without an emf-component (Vemf= 0V). The Vi amplitude and level are determined by the voltage level V but in a different way. When the V level is 0 Volt there is only the base line: no voltage to modulate. When the V level is positive, an Rbe increase will cause a Vi decrease, thus resulting in a sine wave phase shift between the Vi response fluctuation (Fig. 9B) and the Rbe sinewave fluctuation (phase as in Fig. 9A). Also, a more positive voltage V level causes a higher level of Vi but a higher Vi fluctuation amplitude as well. However, when the V level is negative a lower Rbe causes a more negative Vi response and the phase shift with the Rbe fluctuation disappears.
When Vemf and Rbe fluctuate both sinewave like the Vi responses are cooperating when the V level is negative and counteracting when the V level is positive (Fig. 9C). At +10mV the counteraction is complete; results in a flat line Vi response in this example and at +20mV the R-component is stronger and shows the same sinewave phase shift as in Fig. 9B. The calulated responses show similar interactions as the observed in E2 aphid signals (Fig. 8). At the 0Volt level only the emf-components play a role.
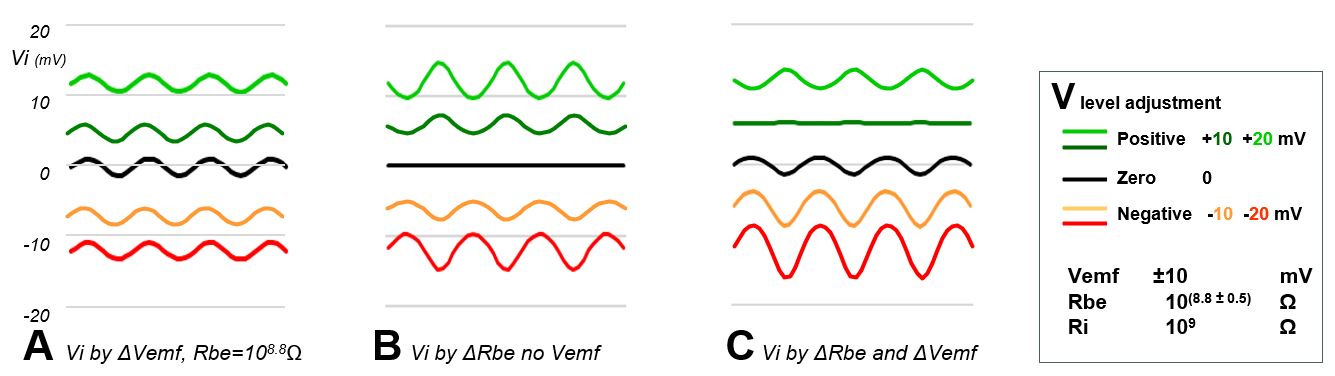
Figure 9. Simulated signal responses Vi as caused by emf-Rbe interactions in accordance to Ohm’s law relationships
Conclusions. There are serious interactions between emf- and R-components and their effect on the EPG signal depends very much on the voltage level and sign of the circuit voltage V, the fluctuation range of Vemf and Rbe. Though the input resistance Ri is important too (Chapter 8), its effect can be overruled by the voltage V level. This level depends on DC contributions of the electrode potentials Pe1&2, but can be user controlled by the voltage supply Vs. The latter is a useful tool to visualize waveforms for indentification (Fig. 8). The sine wave simulation demonstrates these interaction principles.
10. Electrical current
So far only voltages and resistances have been considered in the primary circuit. However, the electrical current through plant and insect plays an important role as well. The input resistance Ri value is crucial for the electrical current through plant and insect (equation [ 2 ]). The lower input resistance than the usual 1GΩ in DC systems has been promoted (Backus et al., 2019) to increase the R‑component sensitivity (ΔVi/V) in large insects with low Rbe, for example. With a lower insect resistance (Rbe) and a lower Ri the current through the plant/insct will increase. In contrast, insect- and plant-physiological experiments should dercrease the electrical current as much as possible (Neher, 1974). Organisms are affected more by electrical current than by a voltage as such (think of birds that have no problem landing on high-voltage wires:high voltage, no current. Large bugs with Rbe resistances of 106‑109Ω facilitate a current increase when decreasing Ri value (Fig. 13). The smaller Rbe and Ri, the steeper the curves. 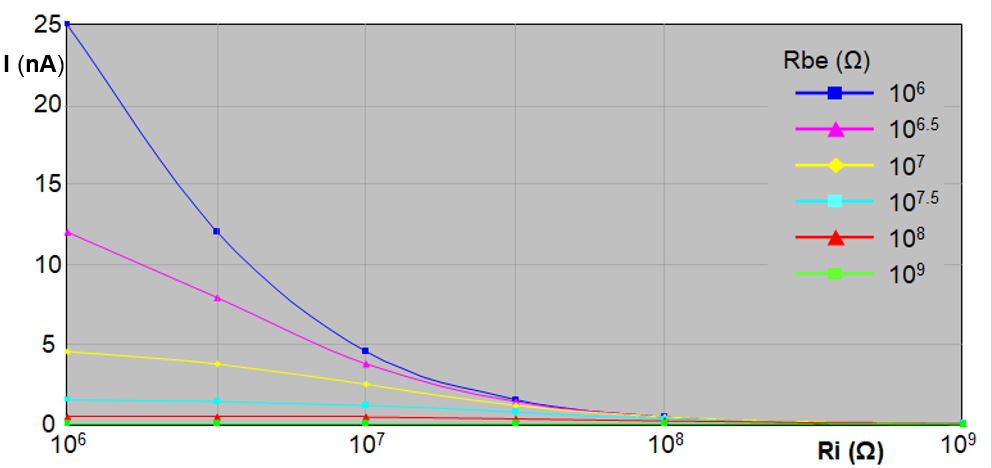 With Rbe of 1MΩ (106Ω) and Ri of 1MΩ too, the current will be 500 times larger than at Ri of 1GΩ. Though the real impact of such a theoretical current increase is difficult to predict, gustatory sense-nerve cells in the pharyngeal cavities will potentially be vulnerable when exposed to this current, which may occur when the cibarial valve is closed and the taste cells in the 16 sensilla pores will conduct the major part of the electrical current, possibly affecting taste perception. Intracellular plant cell punctures will cause a current through the cell's plasmalemma possibly affecting ion fluxes (through ion channels) and electrical signalling in plants. Though the nano-ampere (nA) range of the electrical current impact may be limited, reducing current increase by using a high Ri and V-level adjustment to improve recording of R-components is better than reducing Ri. A higher V-level (as recommanded here) will increase Fig. 10. Electrical current through insects and circuit voltage Vlevel = 50mV for six Ri and Rbe values the current as wel but much less than when using a comparable (large insect matching) Ri: with a V-level of 50mV, an insect resistance (Rbe) of 1 MΩ and an input resistance (Ri) of 1 MΩ too (as suggested by Backus), the current through the plant/insect (Ibe) will be 25 nA (Fig.10), while with an Ri of 1GΩ Ibe will be only 0.05 nA. When a maximum V-level of 500 mV (see Giga-8dd DC system manual) would be used these values will be 250 and 0.5 nA, respectively.
.
III Review of EPG measuring systems
11. EPG systems
11.1 AC EPG systems
The first EPG system was an AC device, called the ´feeding monitor´ was introduced by McLean and Kinsey (1964). It used an alternating current (60Hz AC) voltage supply (Fig.11A; Vs). The AC voltage supply serves as a ‘carrier wave’, the peak-peak amplitude is modulated (AM) by the plant-insect resistance (Rbe) fluctuations, similar to AM radio technology, in which relatively low audio frequencies modulate the high frequency carrier wave amplitude. Also similar to AM technology, this signal was processed into a demodulated output signal reflects the upper envelop representing the resistance fluctuations of the plant-insect. The emf-components as such do not include a resistance fluctuation and do not change the carrier wave amplitude. Also, no low frequency emf components and no voltage level will pass the capacitor (Fig.11A, Ci). Consequently, the AC system is only sensitive to resistance fluctuations in the primary circuit (Fig.1). The AC system therefore, can be considered as a ‘pure R EPG system'. Several other AC systems have been constructed later with different Ri values and higher, more suitable, carrier wave frequencies (Brown & Holbrook,1976; Kawabe et al.,19810. In the more recent mixed AC-DC systems higher frequencies of the carrier wave were used as well (Backus & Bennett, 1992; 2009; see 10.3).
The low input resistance (Ri) of early AC devices needed a higher gain. Also the low original 60Hz carrier wave frequency interfered with the higher frequencies of the emf-component which affected the signal quality.
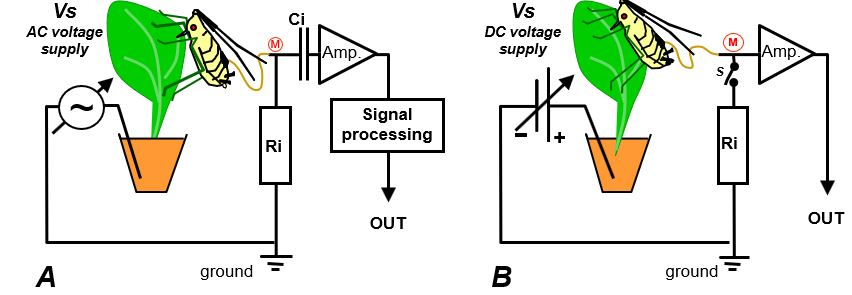
Fig. 11. The primary EPG circuit of two systems. A) The AC system with an adjustable AC (originally 60 Hz) voltage supply (Vs). This system is sensitive to R-components only. B) The DC system with a adjustable DC voltage supply (Vs). This system is sensitive to emf- and R-components (Chapter 8).
11.2 DC EPG systems
11.2.1 Standard DC EPG system
DC EPG systems were developed later ((Fig.11B; Schaefer, 1966; Smith & Friend, 1970; Tjallingii, 1978, 1985, 1988) and they are using a DC voltage supply (Vs). In the standard DC EPG system (input resistance is 1GΩ) the circuit voltage V (Fig. 3) is also "amplitude modulated" by Rbe fluctuations and depends on the Rbe/Ri fluctuation. The voltage V level is reduced more or less (modulated) by Rbe fluctuations and therefore, the R-component sensitivity is expressed by ΔVi/V (chapter 8). However the main advantage over the AC system is its emf-component sensitivity. This appeared when the voltage V-level was adjusted to (about) zero Volt during recording (!). Then no R-components can play a role (no voltage to modulate) and the observed signal (waveforms) should be generated by plant-insect voltage sources (Tjallingii, 1985). Because of sensitivity to both, Rbe and emf fluctuations, the DC system can be considered as an ‘R+emf EPG system’.
11.2.2 Pure emf DC EPG system
The standard DC EPG (R+emf) system has been modified (Giga-8dd model, 2018; see www EPGSystems.eu) by adding a remote controlled switch (Fig.11B; s). When opened Ri changes from 1GΩ to 10TΩ (109Ω to 1013Ω) and since the Rbe fluctuations are very small then the R-components become negligible thus turning the device into a 'pure emf EPG system’. When the switch is open (emf mode) the internal head stage Amp resistance (OpAmp, operational amplifier chip) now determines Ri. When the switch is closed the internal Amp resistance of 10TΩ will be in parallel to the amp external 1GΩ Ri and the resulting shunt resistance will very close to 1GΩ. Thus, with switch open (emf mode) the DC EPG system is a 'pure emf EPG system'.
11.2.3 Differential DC EPG system
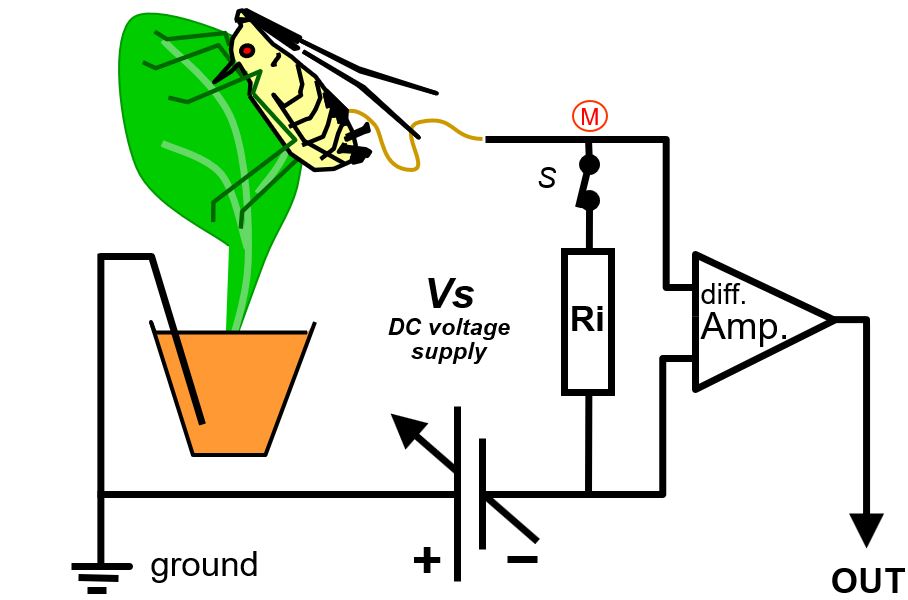
The head stage amplifier (Amp) in DC and AC systems has mostly been used in a ´single ended´ configuration in which only one of the two amplifier (OpAmp) terminals is used (Fig.1, and 11). When using both amplifier terminals Ri can be connected between these and the head stage amplifier will measure the voltage (difference) across Ri and this is called a differential configuration (Fig. 12; now standard in recent model Giga-8dd). There is altering in the Ohm’s law relationships of the primary circuit. In all both configurations, single and differential, the signal voltage Vi (Fig.11 and 12) is measured across Ri but in single ended mode Ri is connected to ground whereas in differential mode the plant is connected to ground (Fig. 12). This configuration has the advantage of that the voltage supply Vs is now via Ri connected to the insect and the adjustment is now on the insect side (Fig.12) instead of on the plant side Fig,12 Differential circuit configuration (Fig.11). Using a device with 8 channels (for recording up to 8 insects concurrently) all plant and the Faraday cage are connected to ground Vs adjustment of each channel is done per insect, not per plant. Electrical isolation between plants and between plants and Faraday cage (thus short circuiting signal of individual insects) is no longer a problem. Also, this allows recording from more than one insect on a the same (single) plant, and EPG recording in the field.
11.3 AC-DC EPG systems
Several combinations of AC and DC systems have been developed and used in order to study how emf- and R-components in waveforms are related to each other.
11.3.1 Dual AC-DC-EPG system
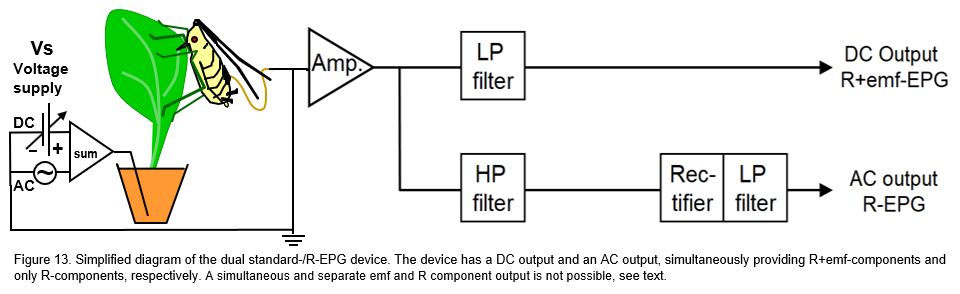
The purpose of this system (proposed by Tjallingii, 2000) was to compare emf-and R-components. The voltage supply (Vs) was a mixed DC and AC carrier wave. The signal contained R-components in the amplitude modulated high frequency carrier wave as well as in the modulated DC voltage V-level. After passing the head stage amplifier the signal was divided into two branches. In the upper branch a low pass (LP) filter removed the modulated carrier waves, passing the same signal as in the standard DC system (10.2.1) to the output. In the lower branch the a high pass (HP) filter only passed the Rbe modulated carrier wave signal. Subsequently this signal was passed through a rectifier and a smoothening LP filter to obtain the upper envelop of the signal, i.e. the same pure R-component signal as in the AC system. These R+emf components from the upper DC output could be compared with the simultaneously recorded R-components from the lower AC output to analyze their feature differences and synchrony. In the studies on thrips (Kindt et al., 2005) and on aphids (Tjallingii et al., 2009 the resulting signals by this dual system showed some interesting differences and similarities that may be worthwhile further specialized studies (Tjallingii et al., 2009). In general, the signals from this device seem little added value in applied EPG studies.in further studies. However, the recordings seem to deliver little added value in routine experiments as compared to results obtained by the standard DC EPG system. One of the dis advantages is that no comparison is possible between simultaneously recorded pure R-component and pure emf-component signals. Recording pure emf-component signals requires a very high Ri (see 10.2.2) value and recording R-component signals requires a low Ri near the ΔRbe fluctuation range. A primary circuit cannot have two different Ri values at the same time, thus allowing no concurrent comparison but only subsequent pure emf- and pure R-component signals.
11.3.2 AC-DC correlation monitor
In recent years the long lasting discussion between AC and DC system properties has been focused on emf- and R-component sensitivity of devices. By introducing the 'AC-CD correlation monitor' (Backus & Bennet, 2009) and its later version (Backus et al. 2019) attempted to get a better ‘balanced’ R-/emf-sensitivity than in the standard DC-EPG system (chapter 11.2.1), especially for larger Hemipterans with a lower electrical resistance (Rbe) than Sternorrhyncha. The device circuit (Fig.14), is slightly (but not essentially) modified here to match the figures of the other system circuit. The supplied voltage (Vs; incorrectly called ‘power supply’) is a mixture of the AC carrier wave and a DC voltage source, amplitude and voltage level adjustable, respectively. The subsequent primary circuit includes a button to select between 6 different input resistance (Ri) values in a 106 to 1013Ω range, the low 3 values of which in order to match insect resistance (Rbe) of large Hemipterans.
Next to the (head stage) amplifier (Amp) there are 3 signal processing branches. In the top branch a low pass (LP) filter blocks the amplitude modulated carrier wave signal components, making the signal from the DC output identical to the signal of the DC system (Fig.11B) and the DC output of the dual AC-DC system (10.3.1). The two lower branches in the original block diagram are identical but can be set either to the middle branch circuit (AC output 1) or to the lower branch circuit (AC output 2). In the AC output 1 branch the signal after the high pass (HP) filter (called coupling capacitor in Backus & Bennet (2009)) only contains the amplitude modulated carrier wave signal. The subsequent rectifier and LP filter will then keep the upper envelop of this signal, similar to AC system (Fig.11A) and the AC output of the dual AC-DC device (Fig.13). The AC output 2 branch seems the recommended branch setting. This implies that the DC level modulated signal (R-component) will be mixed with the AC amplitude modulated carrier wave signal and the DC emf-component. Then not only the DC emf- and R-components will interact (chapter 9) but additionally these two components will interact with the AC R-components. These unpredictable interactions make the signal of AC output 2 unreliable.
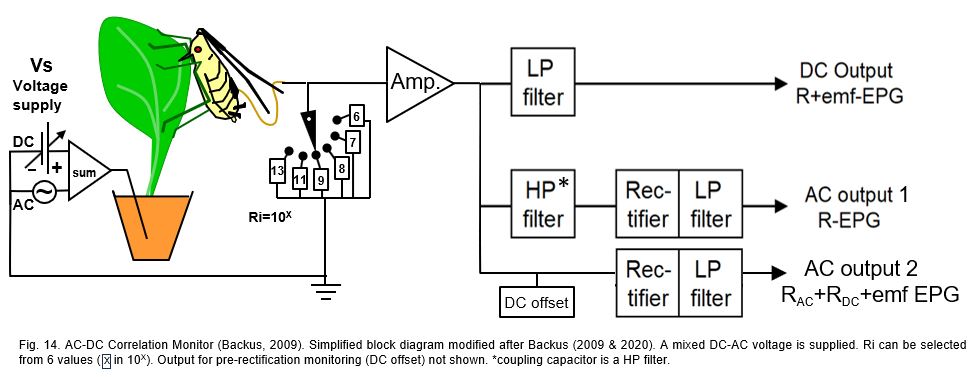
Additional comments. A more practical aspect is the way in which the AC-CD correlation monitor is operated by its users. DC level adjustments in recordings with this device (and other devices by the same authors) were limited to selecting one or several fixed voltages from the voltage supply (Vs) source (incorrectly indicated as ‘voltage signal’, or 'power supply voltage'; there only one signal the EPG output signal, and the power supply runs the device. Using a fixed or zero voltage supply value neglects the intrinsic electrode potentials, which are composing the circuit voltage V (Fig.) the with the voltage supply Vs value. In the AC output 2 branch a negative voltage level will provide unwanted‘ fold-over’ distortions by the rectifier. For this reason a DC offset source is added in the AC output 2 branch, which allows to ‘lift’ the signal to a completely positive level prevent fold-over distortion. Also, an extra offset monitoring the pre-rectification signal is presumably added (2019 version). The DC offset seems redundant since Vs adjustment is suitable do that job.
12. Conclusions
- EPG systems differ in R- and emf-component sensitivity
- The AC EPG-system is exclusively sensitive to R‑components
- The regular DC system (with Ri=1GΩ) is sensitive to both, R- and emf-components
- The DC emf-EPG system (with Ri ≥10TΩ) is exclusively sensitive to emf-components
- Combining a pure R-component (AC) and pure emf-component (DC) in one system is not possible
- The AC-DC dual system separates concurrently recorded AC R-component signals and DC R+emf-component signals, which makes these signals real time comparable
- The mixed AC-DC correlation monitor, similar to the previous device but the intention to mix the AC and DC system signals by enabling the coupling capacitor will cause undesirable AC and DC R‑components interferences in the signal. The developers of monitor claim its superior properties but the opposite seems the case, unfortunately
- The 1GΩ Ri value of the regular DC system provides a compromise between minimizing the electrical current and allowing recording of emf-components a R-components from a wide range of insects. Although the R-component sensitivity at 1GΩ is somewhat reduced for insects with low resistance fluctuation ranges Vs adjustments allows sufficient visual compensation
- For routine EPG recording no comparison or separate emf- and R-components recording is needed
- The importance of R-components is often not clear. Although suggestions and assumptions about biological phenomena related to specific R-components have been made, only little convincing experimental evidence has been provided so far. In a whitefly study (Jiang and Walker, 2001) some waveform fluctuations during pathway were suggested to be caused by insect resistance fluctuation; stylet penetration depth and partial withdrawal. Also, the aphid waveform E2 spikes – assumed to represent salivary valve opening movements (Tjallingii 1978, 1985; then called waveform D and D+E, respectively) – showed an important R-component. These E2 R‑components can perfectly be shown by adjusting Vs more negative; no Ri lowering or matching is needed
- The R- and emf-components in most waveforms are very much entangled and therefore and very similar thus some emf-component dominance will mostly not affect the overall waveform features.
- Ohm's law relations and the role of insect resistance (Rbe) have been incorrectly interpreted in R-component component sensitivities of primary EPG circuits
----------------------- oooooooo -------------------------
Appendix:
Controverses and claimed disadvantages of DC system property failures
Numbered Backus et al. (2020) system controverses and objections to the regular DC EPG systems.
RE: Refutation and comments (Tjallingii)
- DC systems will only provide the best 50:50 balance point of R- and emf-components when used for small insects with an Rbe of about 1-10 GΩ
- RE: See chapter 8. This 50:50 balance point does not exist. It assumes that in addition to the sigmoid sensitivity increase of the emf-component (Fig. 6 and 7) from 0-100% (Y-axis) the R-component sensitivity decreases from 100-0% with an increasing Ri (X-axis). This is the confusion with the f factor mentioned and neglecting the fact that it is the ΔRb fluctuation that determines the recorded optimum R-component, not a fixed (intrinsic) Rbe value.
- The regular DC system does not supply an accurate DC voltage (Pearson et al., 2014) when set to 0 volt (by voltage supply Vs). Instead a certain offset voltage was observed. In older DC systems (Giga-4 and -8) when the Vs knob was manually put on the 0Volt position and in newer versions digitally controlled.
- RE: This criticism is correct, but irrelevant: The unpredictable electrode potentials need a Vs voltage correction to a suitable V-level. Therefore the small deviations from 0 Volt offset play no role. Any initial Vs value is arbitrary and the output voltage of the signal is the only aspect that matters.
- Large insects are more tolerant to AC current and small insects more tolerant to DC current (Backus et al., 2018) as derived from experimental evidence when the DC or the AC voltage supply, respectively was set to 0 volt.
- RE: The experimental evidence seem not reliable since the input, not the output DC voltage set to 0 volt. Insects with the AC treatment were still subjected to the DC voltage of the electrode potentials. And only the input DC voltage was set to a value which means that the output DC voltage was rather different, most likely. Also, the numbers of replicates were very low in these experiments. Thus experimentally and statically these results should be considered as unreliable. Nevertheless, a different tolerance might be possible but that should be studies by different experimental procedure and design.
- The operational amplifiers (OpAmp) used in the DC EPG system are inferior since these would be 'notorious' for drift (Backus 2020).
- RE: The OpAmps (head stage amplifier chip) in all DC EPG systems are all of high quality and similar (CA3240 or comparable) to those used in the Backus' device primary circuit. OpAmp drift is very unlikely and completely negligible in relation to the electrode potentials and their occasional drift (polarization).
----- ooooo -----